In an increasingly data-driven retail landscape, understanding customer behavior in physical spaces is paramount.
While e-commerce has long leveraged analytics to optimize online journeys, brick-and-mortar stores are now turning to sophisticated technologies to gain similar insights.
Among the most powerful of these tools are heat maps for physical stores, which offer a visual representation of customer movement, engagement, and dwell time, transforming raw data into actionable intelligence for retailers.

What are Heat Maps for Physical Stores?
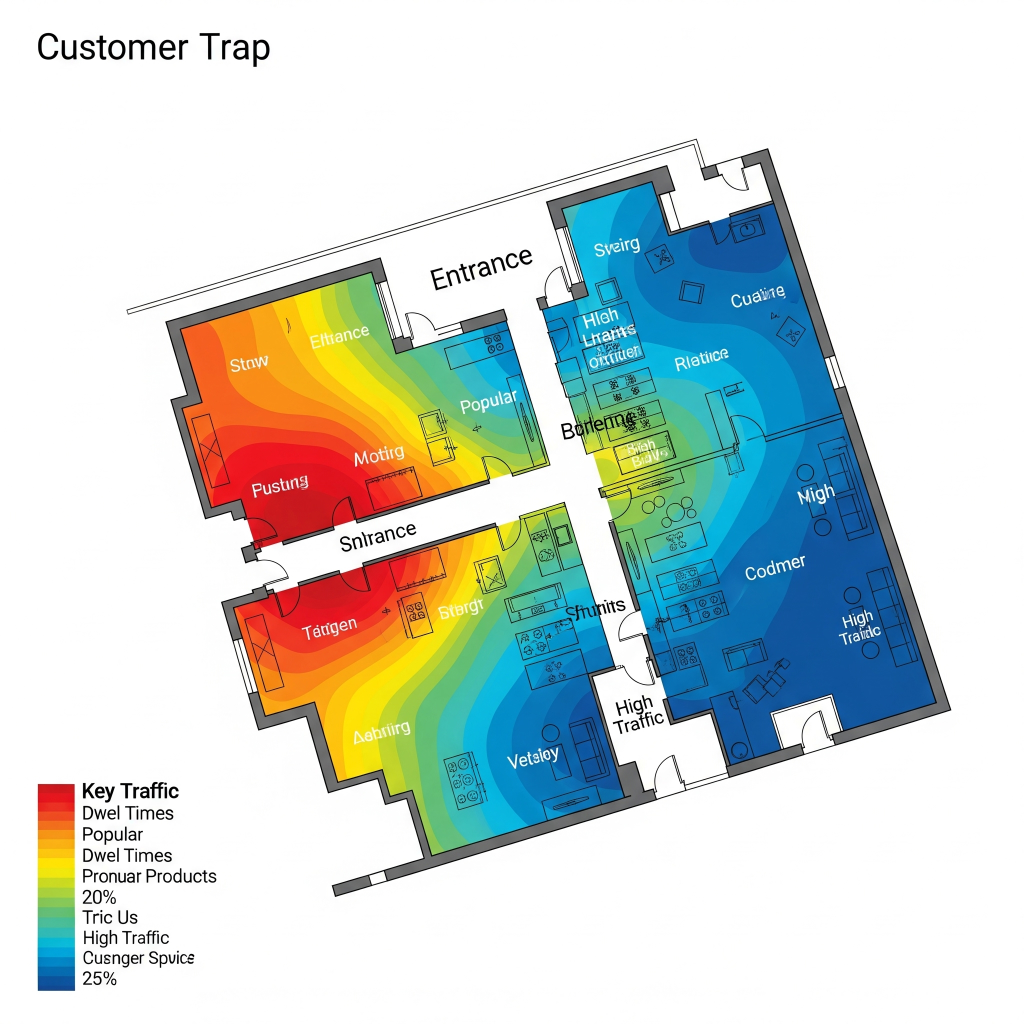
Heat maps for physical stores, sometimes referred to as “spatial analytics” or “in-store analytics,” are visual tools that use color-coded overlays to represent data on a floor plan of a retail space.
Similar to weather maps showing temperature variations, these heat maps depict customer activity, with warmer colors (e.g., red, orange) indicating areas of high traffic, engagement, or dwell time, and cooler colors (e.g., blue, green) representing areas of less activity.
These maps are generated from data collected through various technologies, including:
- Wi-Fi Tracking: Anonymously tracks devices connected to a store’s Wi-Fi network, providing data on overall foot traffic, entry/exit points, and general movement patterns.
- Camera-based Systems (Video Analytics): Advanced video cameras with sophisticated AI and computer vision software can detect and track individual customer movements, group sizes, queue lengths, and even gaze direction (when combined with eye-tracking). This offers highly granular data.
- Bluetooth Beacons: Small, low-energy devices that emit signals that can be detected by Bluetooth-enabled smartphones, allowing for more precise indoor positioning and tracking of customer paths.
- Infrared Sensors/People Counters: Positioned at entrances or within aisles, these sensors count the number of people entering, exiting, or passing through a specific area, providing basic traffic data.
Types of Heat Maps and Their Applications
Different data points can be visualized as heat maps, each offering unique insights:
-
Traffic Heat Maps:
- What it shows: Areas with the highest footfall and busiest pathways.
- Applications:
- Store Layout Optimization: Identify bottlenecks, underutilized areas (“cold spots”), and high-traffic “hot spots.” This helps in redesigning layouts to improve flow and expose customers to more merchandise.
- Staff Allocation: Strategically deploy sales associates to high-traffic zones during peak hours.
- Marketing Placement: Determine optimal locations for promotional displays, signage, and new product introductions where they are most likely to be seen.
-
Dwell Time Heat Maps:
- What it shows: Areas where customers spend the most time, indicating engagement with products or displays.
- Applications:
- Merchandise Effectiveness: Evaluate which displays or product categories are truly captivating customers’ attention. Long dwell times in a specific area could indicate strong interest, but also potential confusion or difficulty finding an item.
- Display Optimization: Refine product presentation in low-dwell areas to make them more engaging. Conversely, analyze high-dwell areas to understand what makes them successful.
- Comfort Zones: Identify areas where customers feel comfortable Browse for extended periods.
-
Engagement/Interaction Heat Maps:
- What it shows: Areas where customers actively interact with products (e.g., picking up items, trying on clothes), or specific fixtures like interactive screens.
- Applications:
- Product Performance: Understand which products are being physically handled or tried on, even if not purchased. This can inform inventory decisions and merchandising strategies.
- Fixture Effectiveness: Assess the effectiveness of interactive displays or sampling stations in drawing customer engagement.
- Sales Conversion Analysis: Correlate engagement with sales data to understand the path to purchase for specific items.
-
Queue Heat Maps:
- What it shows: Areas where customers are waiting, typically around checkout counters or service desks.
- Applications:
- Checkout Optimization: Identify optimal queueing paths, peak waiting times, and opportunities to reduce friction.
- Staffing Levels: Adjust staffing at checkout to minimize wait times and improve customer satisfaction.
- Impulse Purchase Placement: Place impulse items strategically along high-dwell queue lines.

Benefits of Using Heat Maps in Physical Stores
The implementation of heat map technology offers a multitude of advantages for retailers:
- Data-Driven Decision Making: Moves beyond intuition and anecdotal evidence, providing objective data to inform store layout, merchandising, and operational strategies.
- Optimized Store Layout and Flow: Identify “dead zones” and “hot zones,” allowing for strategic placement of high-value merchandise, promotional displays, and staffing. This can improve customer flow, reduce bottlenecks, and increase exposure to products.
- Enhanced Customer Experience: By understanding how customers navigate and interact with the space, retailers can create more intuitive, enjoyable, and less frustrating shopping journeys. Reduced queue times and easier product discovery contribute to higher satisfaction.
- Increased Sales and Conversion Rates: Effective merchandising based on heat map insights can lead to more product exposure, higher engagement, and ultimately, increased purchases and average transaction values.
- Improved Operational Efficiency: Optimize staffing levels based on traffic patterns, identify areas where shelves need more frequent restocking, and streamline daily operations.
- Personalization Opportunities: Advanced systems can sometimes segment data based on demographics or loyalty program participation, allowing for more targeted merchandising.
- A/B Testing in Physical Retail: Test different merchandising strategies or store layouts and compare the resulting heat maps to objectively measure their impact.
- Reduced Shrinkage/Theft: While not their primary function, understanding high-traffic and low-visibility areas can indirectly inform security measures.
Challenges and Considerations
While powerful, implementing heat map technology comes with its own set of challenges:
- Cost: The initial investment in hardware (cameras, sensors, Wi-Fi infrastructure) and software licenses can be significant, especially for larger stores or chains.
- Privacy Concerns: Anonymized data collection is crucial. Retailers must be transparent with customers about how their data is collected and used, ensuring compliance with privacy regulations (e.g., GDPR, CCPA). Most reputable solutions focus on aggregated, anonymous data rather than individual identification.
- Data Overload and Interpretation: Raw heat map data can be overwhelming. Retailers need robust analytics platforms and skilled personnel to accurately interpret the insights and translate them into actionable strategies.
- Accuracy and Reliability: The accuracy of heat map data depends on the quality of the sensors, the sophistication of the software, and environmental factors (e.g., lighting, obstacles).
- Integration with Existing Systems: Integrating heat map data with other retail systems (POS, inventory management, CRM) can be complex but is essential for a holistic view of performance.
- Bias and Anomalies: Unusual events (e.g., a flash sale, a broken display) can skew data. It’s important to analyze data over sufficient periods and account for external factors.
- Infrastructure Requirements: Reliable Wi-Fi, adequate power, and network connectivity are essential for sensor-based systems.
Future Trends in Heat Maps for Physical Stores
The evolution of heat map technology in retail is closely tied to advancements in AI, IoT, and data analytics:
- Real-time Insights and Dynamic Merchandising: Future systems will offer even more immediate data, potentially allowing for dynamic digital signage that changes content based on real-time foot traffic or dwell time.
- Predictive Analytics: AI will move beyond just describing past behavior to predicting future trends, helping retailers anticipate customer movements and optimize inventory and staffing proactively.
- Integration with Staff Communication: Heat map data could be pushed directly to sales associates’ devices, alerting them to busy areas or customers who have been dwelling in a specific zone for an extended period, indicating potential need for assistance.
- Cross-Channel Attribution: Linking in-store heat map data with online Browse behavior and loyalty program data to create a truly unified view of the customer journey, both online and offline.
- Advanced Behavioral Analysis: Beyond just “where” and “how long,” future systems will delve deeper into customer gestures, expressions (with privacy considerations), and interactions to understand intent and emotion.
- 3D Heat Maps: As retail spaces become more complex with multi-level displays and interactive zones, 3D heat maps could offer even more nuanced spatial insights.
Key Providers of Heat Map and In-Store Analytics Solutions
A growing number of companies specialize in providing heat map and in-store analytics solutions for physical retail:
- RetailNext: A prominent player offering comprehensive in-store analytics, including traffic, dwell time, and conversion insights.
- ShopperTrak (Johnson Controls): Known for its foot traffic counting and analytics solutions, providing valuable insights into store performance.
- Prism Skylabs: Focuses on video analytics for retail, offering insights into customer behavior, traffic patterns, and merchandising effectiveness.
- Xovis: Specializes in high-precision 3D people counting and tracking sensors for various applications, including retail.
- V-Count: Provides people counting, queue management, and heat map solutions for retail spaces.
- AFS Technologies (now part of NielsonIQ): Offers retail execution and sales intelligence, which can integrate with in-store data.
- Density: Focuses on real-time occupancy monitoring and space utilization, with applications in retail.
- FootfallCam: Provides advanced people counting and retail analytics solutions, including heat mapping.
- Brickstream (now part of FLIR Systems): Offers intelligent sensor solutions for people counting and behavior analytics.
Conclusion
Heat maps for physical stores represent a paradigm shift in how retailers understand and optimize their brick-and-mortar operations.
By visualizing customer movement and engagement, they provide actionable insights that were once only available to e-commerce businesses.
While initial investment and privacy considerations are important, the long-term benefits of enhanced customer experience, increased sales, and improved operational efficiency make heat map technology an indispensable tool for any forward-thinking physical retailer seeking to thrive in the modern competitive landscape.
As the technology continues to evolve, its impact on the future of physical retail will only grow stronger.